This is Part 2 (of 3) of the blog series on neuronal timescales, you can find here Part 1 and Part 3. I think this one covers most of the actual scientific “discoveries”, if you will. The serendipity/luck that went into making this happen is beyond my comphrehension, but I’d probably be still doing my PhD right now if these stories never happened.
6. discovery! progression of timescales in human cortex (early 2019)
2019: new year old me, but I became a proud contributor of the Toronto Vomit Comet following the New Years Eve party, if that means anything to you. Damn, I gotta do stuff to graduate though? After we were both convinced that I didn’t screw something up in the analyses, Brad, of course, was like “well you gotta check it in humans…have people shown this for the whole humans cortex???” I don’t know, because I haven’t read any papers yet, but I don’t think so. Worth a shot I guess? I’m also going to defer responsibility here because none of this was planned research…
Go on Google, type in “big human ECoG dataset” (or something of that nature, I shit you not), and stumble onto this MNI open iEEG database—with task-free recordings from 1700 electrodes in 100+ epilepsy patients. I have never seen this before in my entire life of parasiting other people’s ECoG data, must be a scam. I download the data, holy shit it’s manually cleaned and organized by brain region, all the data nicely living in a big matrix of time-by-channel, with metadata for electrode location in MNI coordinates, PLUS patient age and sex. Seriously, how lucky can you get? Running this through a modified version of the macaque ECoG pipeline probably took a week or two tops. Plot timescale estimates by brain region: boom, neuronal timescale follows sensory processing hierarchy in humans as well—fast timescales in primary sensory and motor regions, slow timescales in multi-modal and association regions (frontal, hippocampus, etc.).
This was essentially the main finding of the paper, and it really was this easy and fast. On top of that, because the dataset came with patient age information, it was natural to check if there was an across-subject relationship between timescale and age. To be completely honest, this could’ve gone either way at the time and it would’ve made sense: I don’t know if I would’ve hypothesized timescale to increase or decrease with age, though I think that was mostly due to my own ignorance of the aging literature. In any case, a quick check showed that, indeed, timescale tends to decrease with age, and in almost all areas of the brain. Later analyses and converging evidence from various branches of literature would strongly suggest that this is what we should expect as well. I won’t expand on the details here, but the logic is roughly along the lines of aging-related cognitive decline, especially in working memory, as well as the loss of specific NMDA receptor subunit types.
By this point, I think I was also starting to read a bit more into the timescale literature, because… my prayers were heard by the LFP gods and our Cosyne abstract was accepted as a poster presentation against all spiking odds!
I’m going to Portugal!
Another technical side note: to give a little more context, most of the investigation on neuronal timescale, like that John Murray 2014 paper, happens in model organisms (rodents, monkeys) where people can record single neuron action potentials, and there’s a particular way timescale is computed from spikes. The last 5 years of research in that area has shown time and time again that there is a hierarchy of timescales in both rodents and monkeys, so it should be the case in humans as well (your reject-because-lacking-novelty radar should be going off). But for whatever reason—presumably spike chauvinism—mainstream people weren’t really doing this in time series data like LFP and ECoG, and you can’t really get that many neurons from the human cortex, so it remained to be confirmed.
The one exception I know is that of Chris Honey’s earlier human ECoG work in 2012, which already implicated a temporal processing hierarchy in the human auditory pathway by looking at broadband (or high gamma) timescales. So really, we didn’t invent anything new here, except to stumble upon a different (though slightly more precise) way of estimating timescales from the frequency domain, and to apply it to a much larger human ECoG dataset 10 years later. Oh and there was also the difference between spiking and ECoG timescales, so it’s likely that our method measures a fundamentally different process, so maybe there is something new?
7. it’s better to be lucky (Cosyne to SfN, March-November 2019)

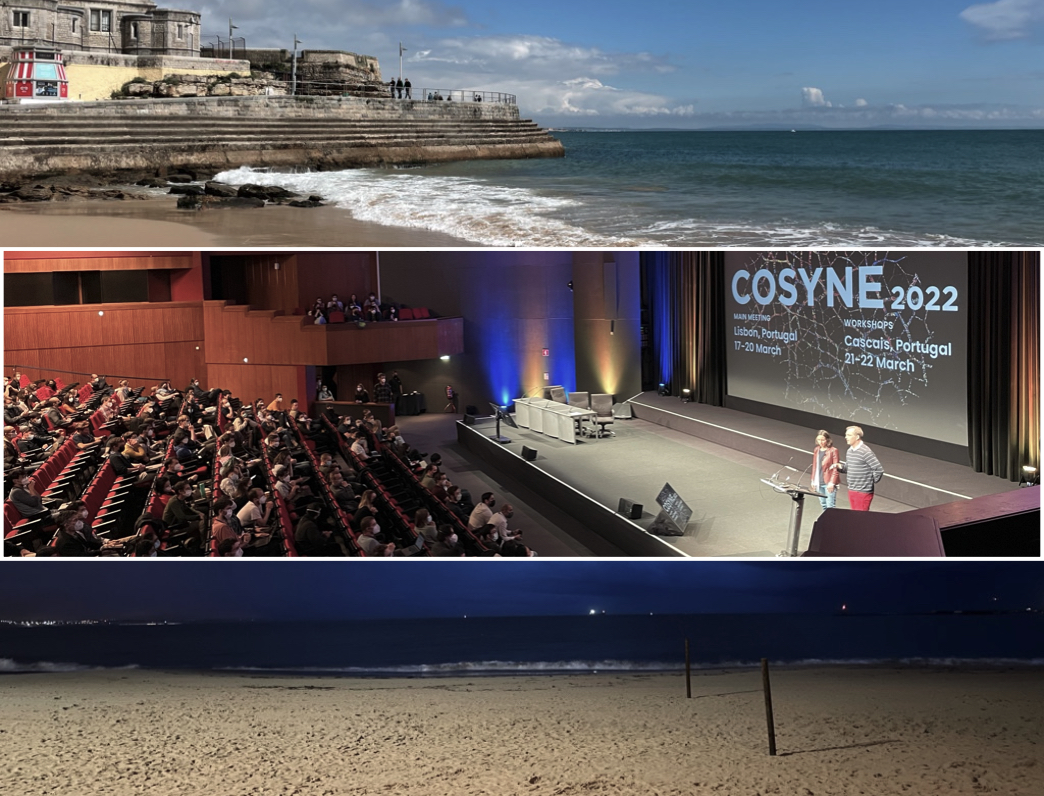
Holy shit I’m in Lisbon, Portugal.
I’m really, really thankful for the collaboration that came out of this conference, not only because it was very productive and fun to work with these guys, but also because I’d otherwise feel very guilty about the fact that Brad keeps funding my exotic international work-vacations.
So I’m there by myself in Lisbon, and I wasn’t aware of anyone I knew at Cosyne because LFP and oscillations are the “exhaust fumes of cortical computation” (hahaha I will never let this go). I spent the first two nights working on a (rejected) grant and then the poster itself, as per usual. During my layover at London Heathrow, somebody said Lisbon is like a depressed version of Barcelona, because its all fun until suddenly everything shuts down at 12am. Not like I was going to go out by myself, but I did forget to bring a power adapter and ended up walking around the whole city the night I landed, trying to find a 7/11-like place to purchase one (did not succeed). Some hotel front desk person tried to sell me a lost-and-found one for 50 euros. Yeah okay there bro. I was eventually fortunate enough to make some friends of friends and had some dinner companions. None of this is relevant to the story, I just thought it was hilarious how woefully unprepared I was.
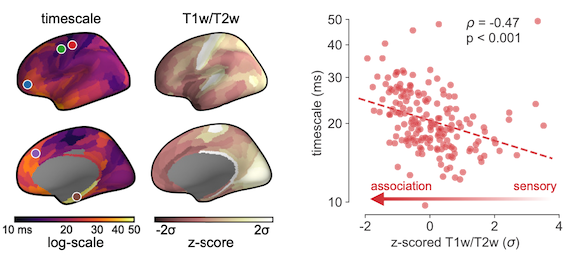
Anyway, the night of my poster presentation, I’m standing there with a box of pasteis de natas (pictured above) because nobody was going to come to a LFP poster, especially if it’s not one of the Gangulis, Sahanis, Harrises, or the likes, so I might as well enjoy myself. Incredibly enough, John Murray (of Murray et al. 2014) showed up, and I wasn’t quite sure what to do with myself for a bit, because I thought he’d think it all sucks or that it’s derivative (because I quite literally ripped the numbers from his paper). But we actually had a great conversation, and he’d suggested comparing the human cortical timescale maps to these “T1T2” (wtf was a T1T2?) and “gene expression” gradients from Burt et al., 2018, to see if there was a nice anatomical correlate to these dynamical timescales.
A bit later in the night, Thomas Pfeffer (my now co-author) came to check out the poster as well. I think we actually talked the night before at his poster, because I knew him from a brief Twitter exchange some years ago about this EI-balanced CROS model his friend was working on, so I recognized his name. He thought my poster was really nice, and suggested, uh, comparing the human cortical timescale maps to these “T1T2” and “gene expression” gradients from Burt et al., 2018 (wtf was a T1T2 gradient???). Even more graciously, he says that his lab mate had made these maps for some other thing, and that he could just email them to me, free of charge. All I’d have to do is to sell him my soul. Just kidding, it was all pro bono. All I’d have to do is align my timescale maps in the same spatial coordinate frame and do scipy.stats.spearmanr (…more or less).
This is what I mean by it’s better to be lucky. More specifically, it’s better to be lucky enough to meet friendly, knowledgeable, and helpful people. Tom and I ended up hanging out a bit more the rest of the conference, especially during the workshops in Cascais. We found another LFP enthusiast in Martin Vinck, who liked the Voytekian line of work, and shared fables of when oscillations were all the rage at Cosyne some 10 years ago. The last night of the workshops was capped off with him playing the piano in the conference hotel bar and then buying us these gigantic German-sized pints before the wrap-up party (who did not attend himself because it was his kid’s birthday the next day). Funny enough, Martin later became the handling editor for the paper at eLife. That’s just how it all worked out. I guess I’m writing this because this kind of stuff really gets me thinking about how amazingly weird life is. Sure, it was great that the collaboration ended up being productive and we had a friendly editor, but it’s not what I’m gonna be thinking about when I’m dead, you know? All that stuff pales in comparison to the memories of “…uh is that Zach Mainen DJing at this club party?”, and walking around the beach boardwalk in Cascais for lunch together talking about how hard academia is. Well, pretty lucky that this was at least part of my job.
I emailed Tom to ask about the data a few weeks after I got home (now April/May 2019), and that lab mate of his turned out to be Rudy van den Brink (our final co-author), who had already done a bunch of work to turn these “T1T2” and “gene expression” maps from voxel space to cortical surface space, and it was literally was just in a big feature-by-region matrix ready to go. Screwing around with comparing those maps to the cortical timescales takes us almost to the end of the year, where I presented my final SfN poster as a PhD student in Chicago (minus a nice 3-week break in the summer where I ended up back in Lisbon, of all places). I was eventually able to convince Tom and Rudy to become proper co-authors, thankfully, because it would’ve taken me 5 times as long to handle that data and write about it myself without the external guidance.
…alright so what are T1T2 and gene expression maps?
8. technical tangent 2: cortical gradients and hierarchies
Scientific context: at this point in the story, all we had was timescale values from the task-free MNI dataset (and the macaque results). It was a semi-replication and extension of existing ideas to humans, which was awesome, but ultimately, what’s the “new thing”? Tom’s idea was that we could look at how brain structure relates to these timescale values. This would give us a clue about how brain anatomy shapes brain dynamics.
What I had literally zero idea of, prior to having that conversation, was this recent explosion of works measuring anatomical hierarchy in the brain (in rodents, macaques, and humans), especially by ways of “macroscale cortical gradients”. There’s a pretty influential idea in neuroscience that the brain is hierarchically organized (Google “Van Essen diagram” for nightmare). It’s actually a pretty loosely used word (see Hilgetag et al., 2020), but here, I’ll just handwave and say that there’s a progression of anatomical features along the cortex, which enables different stages of cortical computation. Put more concretely, the sensory/motor areas of our brains smoothly transition into the multimodal association areas, like from primary motor cortex to the prefrontal cortex, which follows the progression of functional hierarchy, where motor cortex is responsible for immediate motor outputs, and prefrontal cortex is necessary for planning sequences of actions over longer term. This forms the “sensory-to-association axis”, and I hope it’s starting to smell familiar.

Unbeknownst to me, a bunch of recent works, taking advantage of technical advances in various imaging methods as well as really big open data collection efforts like the Human Connectome Project (HCP) and Allen Brain Atlas, have measured many anatomical features across the entire human neocortex. Many of these features follow this S-to-A axis, and these are what we colloquially call cortical gradients or maps, because they (more or less) vary smoothly across the entire human cortex. T1T2 (“tee-one-tee-two”) and gene expression, likewise, are two such measurements of brain anatomy/structure at two different spatial scales:
T1T2 (technically “T1w/T2w ratio”) is a non-invasive metric derived from MRI. It’s a proxy for how much grey matter myelination there is in an area, which is a proxy for the ratio of feedforward vs. feedback inputs to an area, which is a proxy of where along the processing chain an area sits, i.e., “anatomical hierarchy”. Don’t worry, it took me many, many days to get this straight, and I still need to pause to think about it when I see my own figure. The important bit is, the more “association-y” an area purportedly is, the less grey matter myelination there is, and hence the lower T1T2 value it registers from MRI. This is something you can get relatively painlessly: just stick someone in an MRI scanner, and out comes these values. I don’t know, I obviously don’t collect my own data, and thank god for the HCP so I don’t need to.
Cortical gene expression, on the other hand, is NOT something you can get painlessly. The Allen Brain Institute collected 6 post-mortem (deceased) human donor brains ~10 years ago, and was able to measure the expression of some 20 thousand genes at many different sites. Roughly speaking, “expression of gene X” in a brain area = “how much protein X” there is in that brain area. HUGE disclaimer: MORE OR LESS, probably more less than more more—it’s a big ongoing area of research, and there’s more caveats than results, that’s why we have jobs. But again, for brevity’s sake, more gene expression = more protein. What are these proteins? They are the shit that makes up everything in your body. In this particular case, we are interested in little machineries that can define cell types, facilitate transport of ions in and out of neurons, or form neurotransmitter receptors at synapses. Amazingly enough, the expression of these 20 thousand genes follow, to a first approximation, the same sensory-to-association axis as well: some types of synaptic protein become more abundant going along that gradient, and some become less so, some follow more closely, others not so much, etc.
With these maps—which albeit are average measurements taken from different people at different times, so no causal claims here—we can get a pretty crude but comprehensive look at what anatomical features are related to timescale, i.e., how structure may shape dynamics. The prediction is that timescale should inversely correlate with T1T2 (because timescale increases going up the hierarchy while T1T2 decreases), and that depending on which of the 20k genes we are looking at, there would be different expected correlations with timescale. For example, if a gene encodes for a synaptic receptor that prolongs synaptic currents, it should positively correlate with the timescale gradient, and vice versa.
Of course, both of those predictions were confirmed, otherwise I wouldn’t be writing this.
9. all we are is dust in the wind
That’s basically the crux of the anatomical analysis in the paper (Figures 2 & 3). One of the most consistent criticisms towards these analyses was that everything correlates with everything else in the brain, especially these large-scale gradients, for a variety of reasons, including the progression of cortical development, non-trivial spatial autocorrelation, etc. “So what if timescales correlate with cortical myelination, which correlate with gene expression, which correlate with timescale? Is this significant/surprising in any way?”
We included more sophisticated analyses to address this, like gene ontology enrichment analysis to find (in a blind way) clusters of genes that are strongly related to cortical timescale and are functionally related to each other, like synaptic proteins. In addition, I was able to include some analyses comparing the macroscale gradient relationships to single-cell level data. This latter one is probably my favorite analysis of the whole paper. It was certainly the most surprising result for me, and the one that convinced me that there might actually be something real here—something more than just screwing around with numbers in matrices—in a very fundamental biology kind of way.
More importantly, the seredipity behind how that came to be makes me chuckle everytime I think about it: apparently, Brad knows Shreejoy Tripathy from back when neuroscientists answering questions on Quora was a thing. Shreejoy was very kind to invite me to come by the lab at CAMH in Toronto whenever I was home to chat about the organoid stuff. I came home for Christmas 2019, took him up on his offer, and he ended up buying me lunch at this jerk joint I loved to go to when I was still at UofT (Tasty’s at Spadina and College, 5 dollar lunch special, you’re welcome). I met some folks in the lab, got some holiday cookies they were decorating, and inevitably discussed whether organoids had consciousness (jokingly, of course). I mentioned to him this new thing we were working on offhand, and he was like, “huh, you should check out these timescale-related genes we found in our new paper that just came out.” Like, I would have never in a million years thought to do this, because I was not aware of its existence. By “it”, I mean the entire subfield of neuroscience that is single-cell profiling (you: “bro is this guy even a neuroscientist???”). Nevertheless, a month later, I was ripping numbers from a supplementary table in Bomkamp et al., 2019. Can’t make this shit up: space dust coalescing on a space rock, talking to each other over jerk chicken.
Is there a takeaway here? I’m not sure. At the start of this project, I was a signals guy. All of this stuff is the kind of random shit that I’d never expect to learn, but end up having to by pure coincidence, and that’s kinda how it goes in the PhD—rabbit hole after rabbit hole. I thoroughly enjoyed it, and it obviously made the science much more interesting, because now we’re making a link between brain structure and brain dynamics. The actual “result” in those figures above took, I don’t know, 10 minutes to get? Because you just throw these arrays in a loop and correlate. The work leading up to that point, and certifying those results afterwards, are the things that took much longer (if Glasser parcellation, multiple comparison, and spatial autocorrelation means anything to you)—just so you don’t walk away from this thinking I did absolutely nothing. Also, I gotta say, it’s funny now as I write about how I didn’t know any of the literature beforehand, but it damn sure would have made my life easier if I had read those gradient papers earlier. But hey, if you don’t read, make sure you make friends with people who do.
In the next and final installment, I will shock the world by telling a story of a tenured professor running his own analysis, and his graduate student f-ing it up. Oh and, you know, the pandemic…